
True net profit equals revenue minus every variable order cost: product cost, platform and payment fees, shipping, refunds, attributable advertising, and a fair share of overheads. Before anything else, check that your landed unit cost and marketplace settlement data actually map to each order; without that, the rest of the calculation is guesswork. Tools like Xero and Link My Books can automate that mapping, and our ecommerce accountants page covers how we set this up across platforms.
Key Takeaways
Accurate ecommerce profit analysis depends on detailed order-level cost mapping, proper calculation of contribution margins, and effective reconciliation of settlement and VAT data.
| Point | Details |
|---|---|
| Include all variable costs | Add product, platform, payment, returns, and overhead costs to determine true net profit and avoid overstated margins. |
| Use layered contribution margin calculations | Start with net sales, deduct variable costs for CM1, then advertising for CM2, and finally overheads for net profit. |
| Reconcile settlement data regularly | Match payout reports to accounting software to ensure margin figures reflect actual costs and avoid hidden adjustments. |
| Track and analyze cohort performance | Monitor long-term contribution from customer groups to identify profitable channels and optimize CAC payback. |
| Leverage professional support | Specialist accountants help automate settlement mapping, VAT handling, and keep financial models accurate. |
Table of Contents
- Order-level cost checklist: every cost you must include
- Step-by-step calculation method and a worked example
- Interpretation: contribution margin, CAC payback and cohort checks
- Common mistakes and reconciliation traps (why dashboards can mislead)
- Benchmarks and what ‘healthy’ margin ranges mean in practice
- Key UK accounting and VAT considerations that affect margin calculation
- How specialist accounting support improves accuracy and frees time
- Where sellers should start and quick wins
- Practical next step: book help with eAccounts
- FAQ
- Sources
Order-level cost checklist: every cost you must include
Most sellers understate their true costs because they work from gross sales figures instead of building the calculation order by order. The starting point is landed product cost: the manufacturing or wholesale price plus import duties, inbound freight and any packaging bought specifically for that product line. Skip any of these and your gross margin looks healthier than it is.
Next, separate the two categories of fees that get lumped together far too often:
- Transaction fees: marketplace referral or commission fees, plus payment processor charges on each sale.
- Fulfilment fees: pick and pack, warehousing, delivery subsidy and any marketplace fulfilment programme charges.
Treating these as one blended “platform fee” line hides which lever actually moves your margin. A marketplace commission and a card processing fee respond to completely different decisions: one changes with your sale price, the other with your payment mix.
Refunds and returns need the same granularity. Build in an expected returns rate based on your own order history, and account for the cost of processing a return (restocking labour, partial refund admin, and any inventory that becomes unsellable and must be written off). A return that costs you the product, the outbound shipping and the processing time is a bigger hit than a simple refund of the sale price.
Finally, allocate operating overheads conservatively. Rent, software subscriptions, core staff time and insurance do not disappear just because they are not tied to a single order. The order-level model from StoreBuilt’s contribution margin guidance treats these as a separate layer below contribution margin rather than folding them into per-unit cost, which keeps the per-order numbers clean while still giving you a true bottom line once overheads are deducted.
Getting this checklist right the first time avoids the common mistake of discovering, months later, that a “profitable” product line was never covering its full cost.
Step-by-step calculation method and a worked example
A reliable model builds up from net sales in layers, rather than trying to net everything off in one step.
- Start with net sales: gross sale price minus any discounts, before VAT.
- Deduct directly variable order costs: landed product cost, payment and marketplace transaction fees, pick and pack, delivery subsidy and an allowance for expected returns. The result is CM1 (contribution margin one).
- Deduct attributable acquisition cost: the advertising spend you can tie to that order or that product. The result is CM2 (contribution margin two).
- Deduct allocated overheads: a prorated share of fixed costs such as rent, software and core payroll, to arrive at operating or net profit for the period.
This structure, which StoreBuilt describes as starting at net sales and deducting product cost, discounts, payment fees, fulfilment and returns before separating out paid media as a distinct layer, keeps each decision visible: you can see whether a product is profitable before advertising, and whether advertising is the thing eating the margin.
Pull your numbers from the right place each time: net sales and fee breakdowns from the marketplace or Shopify payout reports, carrier invoices for actual shipping cost (not just the subsidy charged to the customer), ad platform reporting for spend by campaign or SKU, and your accounting software for the overhead figures.
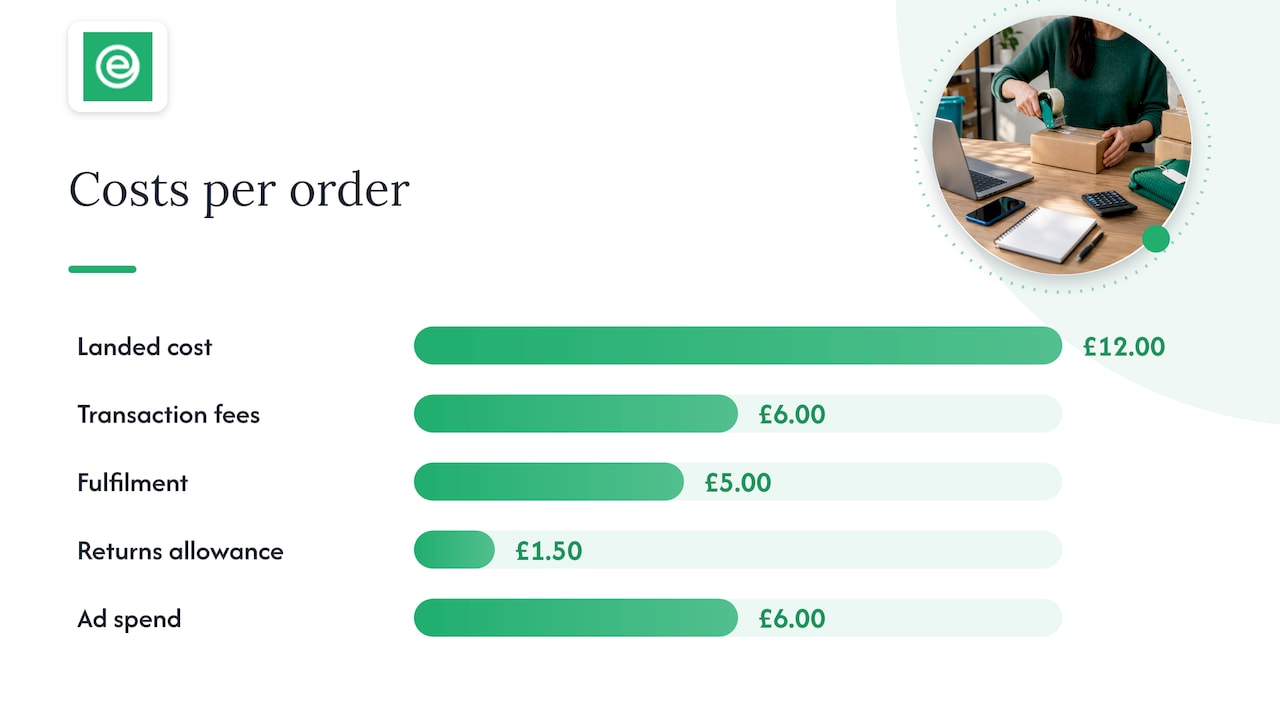
Here is a worked example for a single order, figures chosen purely to illustrate the arithmetic. Say a product sells for £40.
- Net sales: £40.00
- Landed product cost: £12.00
- Marketplace and payment fees: £6.00
- Pick, pack and delivery subsidy: £5.00
- Returns allowance (modelled): £1.50
- CM1: £40.00 minus £24.50 = £15.50 (38.75% of net sales)
- Attributable ad spend: £6.00
- CM2: £15.50 minus £6.00 = £9.50 (23.75% of net sales)
Once you have CM2 for a period, deduct your pro-rated overhead share to reach net profit.
Pro Tip: Run this model weekly for your top 20 SKUs by volume rather than trying to cover the full catalogue at once; it surfaces the biggest wins fastest.
Reconcile the model’s totals against your bookkeeping reports each month. If the gap is wide, the usual cause is a settlement adjustment or VAT line that the spreadsheet model missed but the accounting software caught.
Interpretation: contribution margin, CAC payback and cohort checks
CM2 is the number that tells you whether paid acquisition is actually working. Customer acquisition cost (CAC) payback measures how many orders, or how much time, it takes for a customer’s cumulative CM2 to cover what you spent acquiring them. A customer who generates £9.50 of CM2 per order pays back a £20 acquisition cost within roughly two orders, assuming margins hold steady.
For small sellers, a useful guardrail is to track payback in order counts rather than days, since purchase frequency varies wildly by category: a supplements brand might expect payback within one or two repeat orders, while a homeware seller may plan around a single larger basket.
- Run cohort checks at 30, 60, 90 and 180 days to see how contribution accumulates, not just how it looks on day one.
- Watch for cohorts that never recover CM2, which signals the acquisition channel or offer needs rework rather than just the product cost.
- Accept some low-margin SKUs deliberately when they reliably pull in a bigger basket or anchor repeat purchases, but only if you can show that pattern in the data.
Cohort analysis also catches a problem that a single-period snapshot hides: a channel that looks profitable in month one can turn negative once returns and repeat discounting show up in month two or three.
Common mistakes and reconciliation traps (why dashboards can mislead)
Platform dashboards are built to show sales momentum, not profit, and that shapes what they leave out or delay. Refunds often post to the dashboard days after the original sale, VAT is sometimes included in headline revenue figures, and settlement adjustments (chargebacks, late fee corrections, inventory reimbursements) can land in a completely different reporting period from the sale they relate to.
- Match settlements to Xero or QuickBooks by payout, not by order date, since payouts bundle several days of activity into one bank line.
- Treat unexplained settlement differences as adjustments to investigate, never as rounding to ignore.
- Version your cost assumptions with a date, so a change in shipping rate or supplier price does not silently rewrite last quarter’s margin.
- Check data completeness before trusting a margin figure: confirm every fee type, refund and ad cost source is actually feeding the model.
Automating the link between settlement data and your accounting system, as tools like Link My Books do for cost of goods sold tracking, prevents the kind of silent historical rewrite that happens when someone updates a cost assumption without flagging which periods it applies to.
A reported margin is only as trustworthy as the weakest input feeding it, so treat any gap in fee, refund or ad data as a reason to hold off on big decisions until it is closed.
Benchmarks and what ‘healthy’ margin ranges mean in practice
Public retailer averages are a poor yardstick for an individual seller because category, scale and fulfilment model all change what “healthy” looks like. A print-on-demand seller with no inventory risk and a furniture importer with high freight costs will never share the same expected gross margin, and comparing your numbers to either without adjusting for your own category tells you very little.
- Treat gross margin, CM1 and CM2 as your own internal benchmark, tracked period over period rather than against an industry figure.
- Expect ranges to shift with scale: fixed costs spread thinner as volume grows, which lifts net margin even when gross margin stays flat.
- Use the margin stack to find the biggest lever: for most sellers, payment and marketplace fees or returns rate move the needle faster than shaving a few pence off product cost.
Build your own baseline from two or three months of clean data, then judge every change against that baseline rather than an external number that was never measuring your business.
Key UK accounting and VAT considerations that affect margin calculation
VAT sits inside several of the numbers above whether you notice it or not, and leaving it in by mistake is one of the fastest ways to overstate your margin.
- Know your registration trigger: you must register for VAT once your taxable turnover crosses £90,000 on a rolling 12 month basis, and this threshold was raised to its current level, changing which sellers need to account for VAT at all.
- Strip VAT from revenue before calculating margin, since settlement reports sometimes show gross figures that still include the VAT element of a sale.
- Note that scheme choice changes reporting mechanics: Flat Rate and schemes like OSS or IOSS for cross-border EU sales affect how VAT is calculated and reported, not whether it should be removed from your margin figures.
- Bring in an accountant for multi-jurisdiction VAT, since marketplace settlements covering several countries get complicated quickly and the cost of getting it wrong is higher than the cost of advice.
Our guide on VAT registration timing and our VAT schemes overview cover these mechanics in more depth.
How specialist accounting support improves accuracy and frees time
Building this model once is useful. Keeping it accurate every month, through fee changes, new SKUs and VAT scheme shifts, is where most sellers run out of time.
- We set up Xero so settlements map to orders automatically, closing the gap between dashboard numbers and real cost.
- We handle COGS and inventory configuration, so landed cost flows through to your margin without manual spreadsheet work.
- We manage VAT and IOSS reporting, including registration timing against the £90,000 threshold and scheme selection.
- We run regular reconciliations between marketplace settlements and your accounts, catching the adjustments a dashboard misses.
Every client works with a dedicated accountant who stays with your account rather than passing you between teams, which matters most in the first few months while cost assumptions are still being refined.
Where sellers should start and quick wins
If you take one thing from this, fix landed cost and returns mapping before anything else. Advertising attribution matters, but it is meaningless when the product cost underneath it is wrong.
Run a light check weekly on your top sellers, then a fuller reconciliation monthly against your accounts. Label every assumption with a date and measure how complete your fee and refund data actually is before you spend time optimising a number you cannot fully trust yet.
— Kris
Practical next step: book help with eAccounts
Getting landed cost, settlement mapping and VAT handling right takes ongoing attention, and that is exactly where we spend most of our time with ecommerce clients.

- We map Shopify, Amazon, eBay and Etsy settlements to Xero, so your CM1 and CM2 figures reflect reality, not a dashboard estimate.
- We handle VAT registration and IOSS reporting, including the £90,000 threshold check.
- We reconcile accounts monthly so a margin figure you report is one you can defend.
Plans start from £29 + VAT a month, and you can see what is included on our ecommerce accountants page or compare options via choose your package.
FAQ
What is the definition of gross profit margin?
Gross profit margin is revenue minus the direct cost of the goods sold, expressed as a percentage of revenue. It measures how much is left after product cost alone, before fees, shipping, advertising or overheads are deducted.
Is a 75% gross profit margin good?
A 75% gross margin can be strong for categories with low product cost, such as print-on-demand or digital-adjacent goods, but it says nothing about profitability once fees, fulfilment, returns and advertising are deducted. Compare it against your own CM1 and CM2, described in the step-by-step calculation above, rather than treating it as a standalone target.
How do you calculate profit in ecommerce?
Start from net sales, deduct directly variable order costs such as product cost, transaction fees, fulfilment and returns to get CM1, then deduct attributable advertising to get CM2, then deduct a pro-rated share of overheads to reach net profit. Each layer should be checked against your actual accounting records, not left as a spreadsheet estimate.
How do you calculate cost of goods sold with margin?
Cost of goods sold (COGS) is the landed cost of the units actually sold in a period: purchase price plus duties, inbound freight and directly related packaging. Once you have COGS, margin follows as (revenue minus COGS) divided by revenue, expressed as a percentage.